Troubleshoot with auvik, How do I use
ALERT
Network issues normally as we know, it will be ” I can’t Ping” or “I don’t have internet”. But it can caused by different problems. Using TCP/IP Model to troubleshoot from bottom to up or Up to Bottom. The problem is, you will need to spend time login to the device and put command to gather data for you to analysis. It can takes a long time.
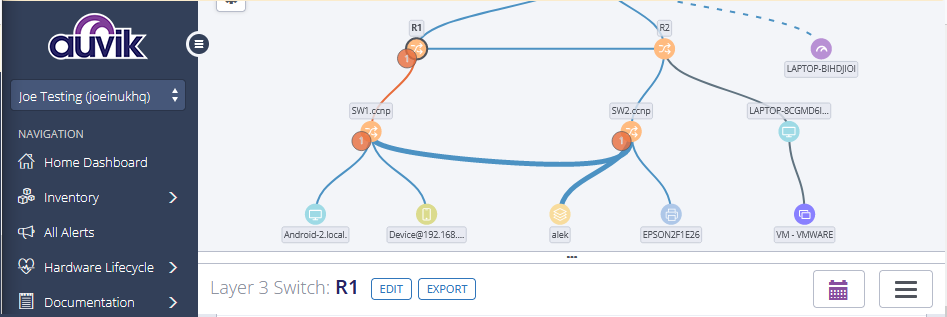
When you see some small numbers on the map as above, which mean those devices had some issues & need your attention. Usually we will see few type of alert:
- High Broadcast Traffic
- High Packet Discard
- High Interface Utilization
_________________________________________________
Report – Network Device Utilization
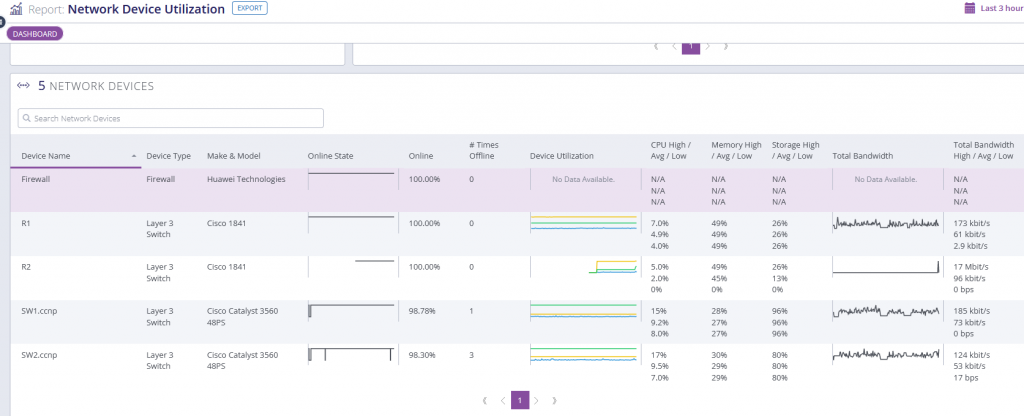
(Figure 1.1)This report can quickly give you an insight over a period, how healthy are those network devices. Is it all the time online ? Are they working too hard ? Is the bandwidth you expected ?
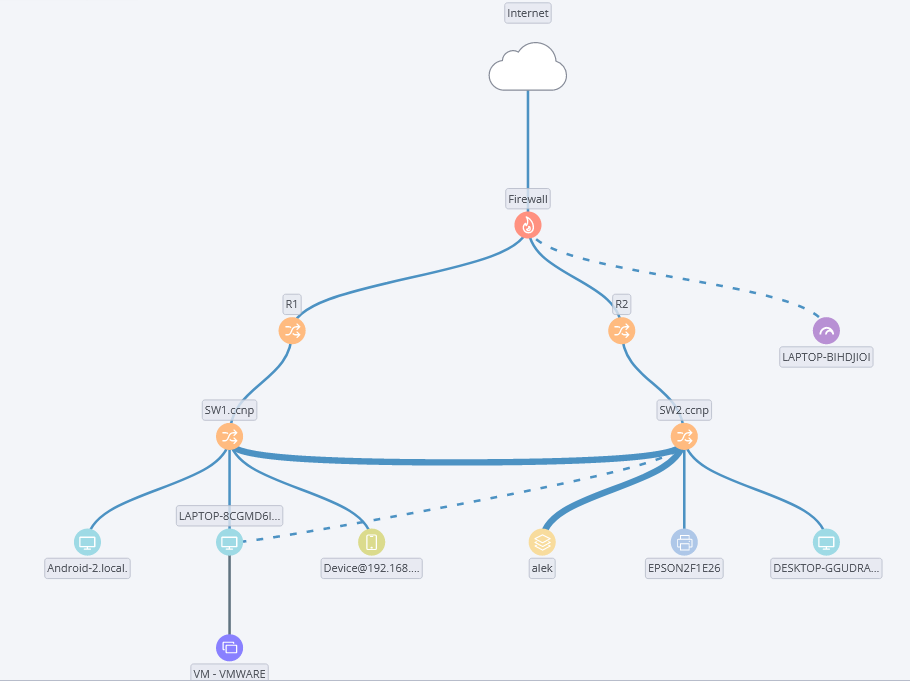
Refer to Network Map at the top, R1 & R2 are both connected to Firewall, To achieve redundancy/ failover. But you can’t see that in the map is the rule in place?
STANDBY / FAILOVER
Although you can’t see it in the map, But auvik will give you alert. when the active interfaces goes down. In this case, I will put R1 as Active , R2 as Standby. When R1 go offline, It will failover to R2. We will see How Auvik will tell us.
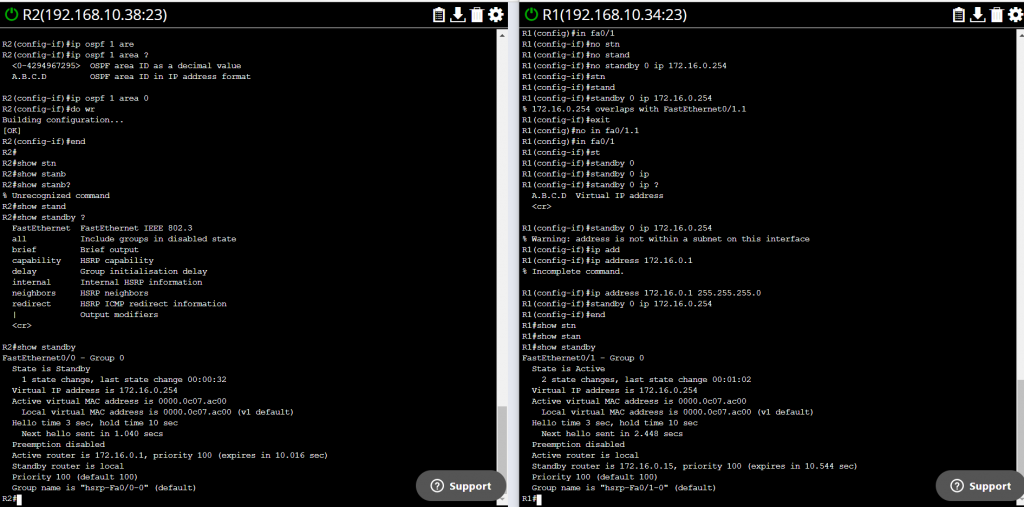
After I shut down the R1 Interface FA0/1. First thing, we will see there is a number on Router at Auvik’s map. That is telling us, 1 interfaces has gone down.
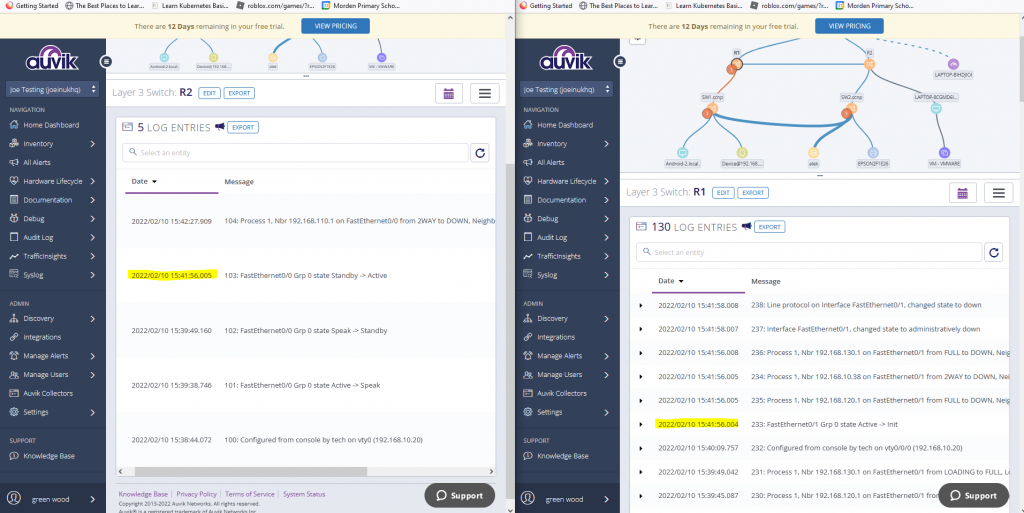
In syslog, we can see at 15:41R1 from Active to Init, R2 became Active.
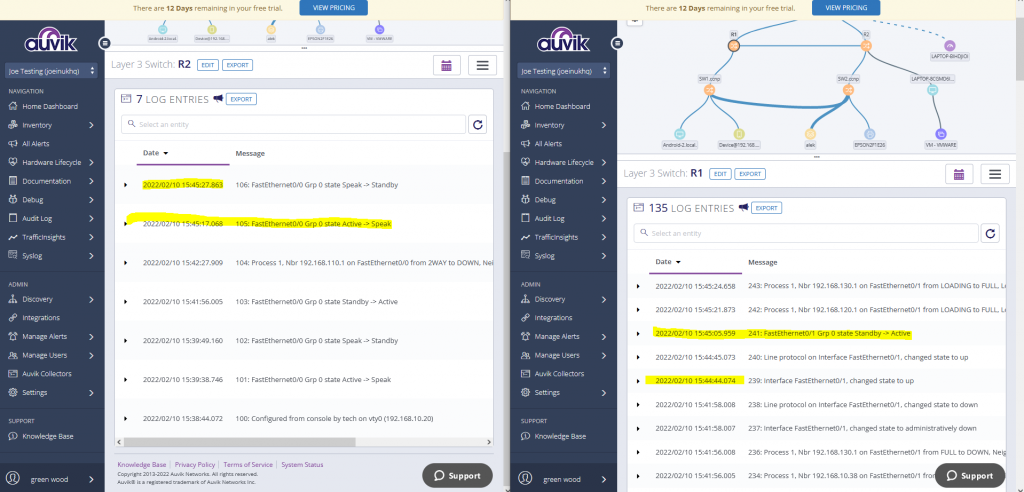
When the problem resolved, we can at 15:45 R2 from Active to Speak and R1 from Standby became Active. Which you will need to enable syslog from your Router. As Auvik only tell you the alert ” your interfaces is down now”.
_________________________________________________
Report – All Interfaces by Utilization
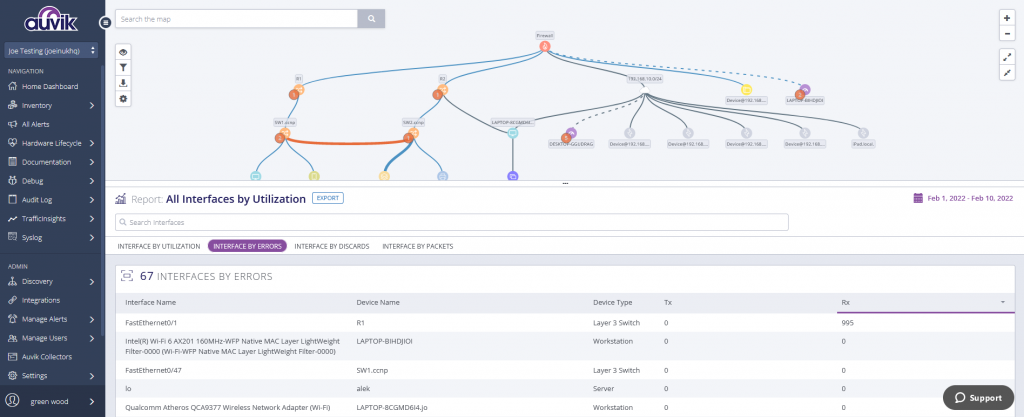
In this report, you can easily find Interface by Error/ Discards, Also you can sort it by top interfaces. Bottom it down which devices are the root cause quickly.
_________________________________________________
Device Utilization ( Troubleshooting View) & Device Packets (Troubleshooting View)
Once your find which device you need to look at. On Device page, they do have troubleshooting view which is very helpful.
Figure 3.1, you can quickly find out which interface got the most discard/ Error and Also it is connected which device in the other end.
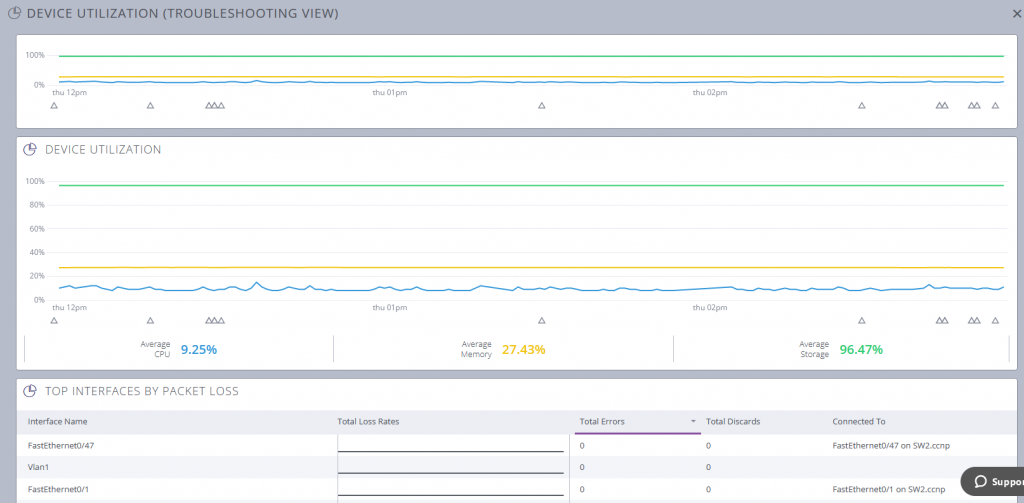
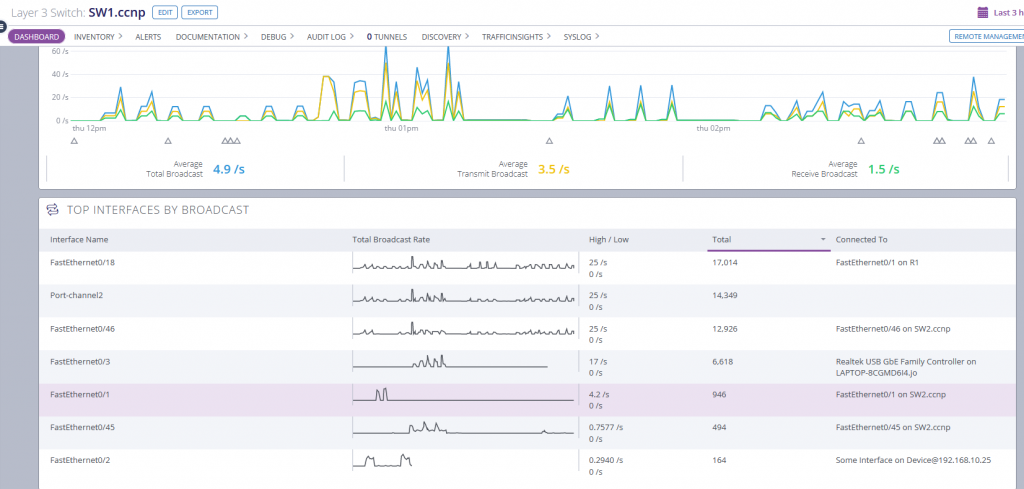
Figure 3.2, 3.3, High Broadcast traffic can cause network performance issues. Regarding to High broadcast traffic, storm control is something you can use. It is good to control it. In this troubleshoot view, Again you can see which device is connected to this interface, how is the broadcast rate over a period.
You can also see Multicast & Unicast traffic.

Ethernet Channel
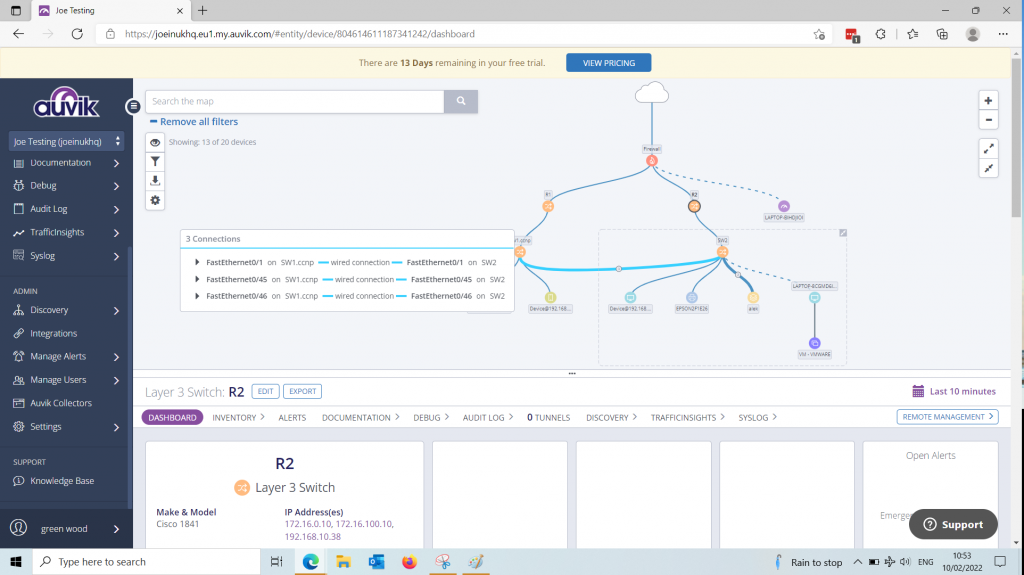
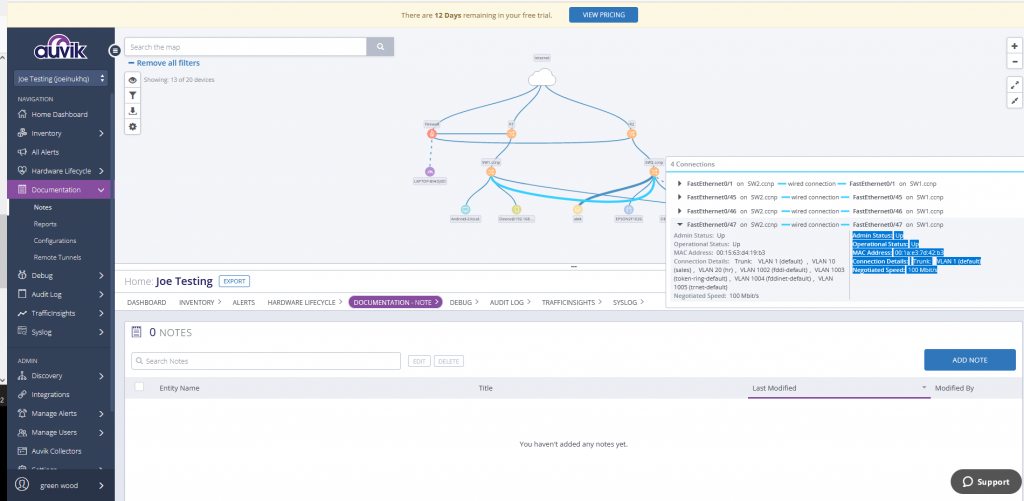
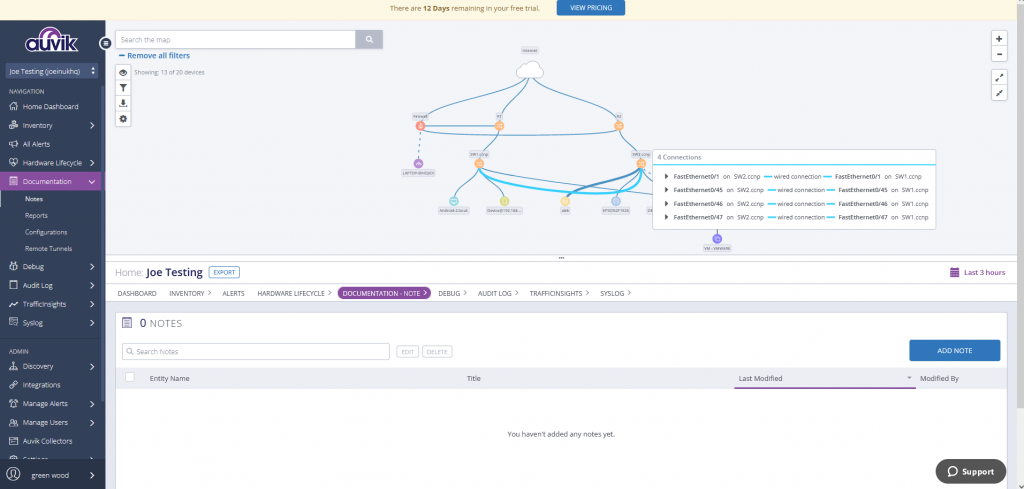
Port Channel in Auvik, you will see a number on the connection line. When you hover your mouse on the line, it will give detail on the connected interfaces and how many interfaces are connected. When those interfaces are less than you expected, which mean one is down.
Time to troubleshoot.
_________________________________________________